
HPjmeter 4.3 User's Guide

The length of time needed to collect sufficient data depends on the application size, the load
imposed on the application, and on the selected preferences. Typically, a wait of 5 to 30
minutes provides sufficient data to begin seeing significant clues to the application behavior
and performance. A longer collection time gives you greater accuracy in the results. For details,
see: Setting Monitoring Session Preferences (page 117) .
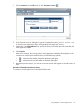
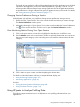
Changing Session Preferences During a Session
With HPjmeter 4.0 and later, it is possible to change session preferences during a session.
1. Double-click the “Open Session” line in the console for the session that you want to change.
The Session Preferences window opens.
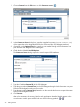
2. Alternately, selecting the “Open Session” line on the console enables the Session Preferences
icon on the console tool bar. Click the icon to open the Session Preferences window.
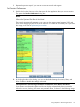
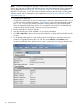
View Monitoring Metrics During Your Open Session
1. Click on the open session or time slice to highlight the data that you would like to view.
2. Use the Monitor menu on the console main window to select the metrics that you want to see.
Mousing over each category in the cascading menu will reveal the relevant metrics for that
category.
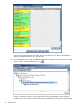
3. Click a metric to open a metric visualizer displaying the chosen data.
For details on individual metrics and how to interpret the data display, see:
• Using Monitoring Displays (page 135)
• Monitoring Applications (page 46)
See also:
• Saving Monitoring Metrics Information (page 48)
• Using Visualizer Functions (page 134)
Using HPjmeter to Analyze Profiling Data
The following steps summarize how to use HPjmeter to view profiling information from your
applications.
Using HPjmeter to Analyze Profiling Data 39