
HPjmeter 4.3 User's Guide
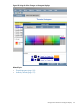
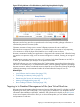


Figure 87 Early Indicator of Possible Memory Leak Using Heap Monitor Display
HPjmeter uses the long term linear upward trends in the heap size after garbage collections to
calculate the presence of memory leaks.
Short-term increases in heap size are normal. HPjmeter measures this rate in MB/hour.
HPjmeter does not report a leak in situations in which the heap size increase is only temporary,
or in situations in which the slope of the fitted line is too small to raise an alarm.
However, sometimes a healthy Java application is diagnosed with a memory leak. When the heap
size returns to its previous range, such an erroneous diagnosis is revoked, reverting to its original
state.
Leak detection accuracy improves over time, so if a memory leak alarm fluctuates on and off, or
in value, you should base your analysis on the present alarm state.
With high leak-rate, you can consider having the IT administrator start another JVM and stop the
old one in a controlled way, in a clustered environment, when the garbage collection percentage
becomes excessive. What is considered excessive depends more on the rate of change of garbage
collection percentage or the estimated number of minutes before the heap will run out.
Related Topics
• Java Collection Leak Locations Alert (page 129)
• Confirming Java Memory Leaks (page 53)
• Determining the Severity of a Memory Leak (page 53)
• Memory Leak Applications (page 43)
• Basic Garbage Collection Concepts (page 103)
Tapping in to Standard Management of the Java Virtual Machine
HPjmeter retrieves information about the state and activity of the JVM (Java 1.5 or higher) on HP-UX
by making use of the JSR-174 API (http://www.jcp.org/en/jsr/detail?id=174). HPjmeter collects
information about MXbean notifications, attributes, and operations for display in the JMX viewer.
It uses control aspects of the API to allow you to see and manipulate your own MBean attributes
and operations in real time.
Tapping in to Standard Management of the Java Virtual Machine 215