
HPjmeter 4.3 User's Guide


agent spends almost all its time blocked on socket and first-in first-out (fifo) waits. When the node
agent is managing open sessions, overhead is extremely low.
The physical memory footprint of the node agent is about 1 MB when idle and 1.5 MB when
active.
Console Overhead
You should not run the console on a machine that is a managed node to minimize impact on your
system.
The console uses 512 MB of memory on Microsoft Windows and 1 GB of memory on UNIX systems
by default. For a long-running monitoring session, you should start the console with >1 GB of Java
heap or more.
Data Sampling Considerations
HPjmeter uses sampling, rather than exact counts, to minimize the overhead of data collection on
applications. The accuracy of data collected by sampling increases with the number of samples.
The time required to collect enough samples to get good accuracy varies, depending on the
sampling frequency.
The sampling frequency employed by HPjmeter can vary among metrics. A disparity in sampling
frequency can create seeming discrepancies between some data displays when the real issue is
that you are viewing different data samples or cumulative records of different sample intervals.
Keep this in mind when comparing data presented in various related metrics.
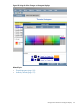
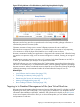
Using Confidence Interval to Indicate Sample Validity
HPjmeter uses a confidence interval to give you a real-time view of the current accuracy of certain
metrics.
For example, the Java Method HotSpots window shows the confidence interval numerically as a
plus-or-minus percentage that appears just to the right of the measured value. A gray diamond
underlies the text to show a graphical representation of the confidence level.
The horizontal positioning of each gray diamond represents the measured value in relation to the
other measured values in the display. The width of the diamond represents the percent confidence
interval. The real value measured lies somewhere within the range of confidence represented by
the diamond.
During a live session, the width of the confidence interval shrinks over time as the statistical
confidence in the value increases.
This example shows a high confidence in the results, denoted by the narrow gray diamonds in the
display.
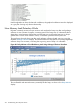
This example shows low confidence in the results, denoted by the wide gray diamond shapes.
Data Sampling Considerations 213