
HPjmeter 4.3 User's Guide


9 Understanding How HPjmeter Works
Here are details on how HPjmeter works to collect and display metrics.
Performance Overhead on Running Applications
HPjmeter is designed to minimize data collection overhead on deployed applications. The most
significant change you will notice is slightly longer application server startup times.
Application Server Startup Time
HPjmeter uses load-time bytecode instrumentation to reduce overhead in deployment situations.
The load-time processing increases application server startup time, the time from invoking the
application server startup script until the application server is ready to accept requests, by several
minutes.
This overhead also allows HPjmeter to avoid preprocessing application server or user code.
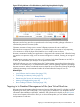
Monitoring Overhead
HPjmeter provides lightweight data collection designed for deployment-time monitoring of live
applications. For a typical Java application, when a session is not open (the HPjmeter JVM agent
is in dormant mode), the application overhead is very low. When a session is open and collecting
data (active mode), overhead is higher than in dormant mode with default settings , but still is
typically low. Once a session is closed, overhead returns to a very low level.
Overhead depends on the set of filters and flags you specify. To minimize overhead, you can use
the nohotspots and noalloc options to disable the Java Method HotSpots and Object Allocation
metrics for the lifetime of the JVM agent.
Using include and exclude filters, may increase or decrease overhead, respectively. The
include option provides more monitoring detail but increases overhead while the exclude
option decreases overhead by providing less monitoring detail.
By default, application server classes are not instrumented, which minimizes overhead and focuses
measurements on your code.
Changes in Memory Overhead With Dynamic Attach
Users running their application with Java 6.0.03 can take advantage of dynamic attach features
in HPjmeter 4.3. With support for dynamic attach, HPjmeter can find JVMs automatically upon
connecting to a server, without needing to start the JVM with HPjmeter options on the command
line. Until the HPjmeter JVM agent is dynamically loaded into the JVM, no overhead is incurred.
In addition, bytecode instrumentation is removed when the console is disconnected from the JVM
agent. Temporarily removing the instrumentation also lowers the overall overhead of a monitoring
session.
Profiling Overhead and Intrusion
A major side effect of profiling is that the profiling itself consumes memory and CPU time. This
introduces two problems. One is overhead - you'll notice that the profiling runs take longer than
normal runs—sometimes substantially longer. The other problem is intrusion. When the metrics
collection uses the same resources that you want to measure, you get the numbers not only for the
application, but rather for the application plus whatever you use to collect the metrics.
Node Agent Overhead
CPU usage is negligible for a node agent with no connections, a node agent without a console
attached, and a node agent with a small number of open sessions. The reason is that the node
212 Understanding How HPjmeter Works