
HPjmeter 4.3 User's Guide
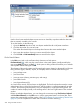
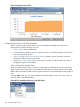
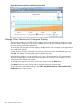

To drill in further, repeat this method of defining the area of view until you reach your desired
resolution.
Use the slider underneath the graph to view additional ranges in the data without changing the
resolution interval.
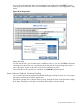
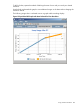
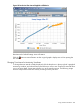
The following images show a selected area on a graph and the resulting display.
Figure 81 Specialized GC Graph with Area Selected for Finer Resolution
Using Visualizer Tool Bars 207