
HPjmeter 4.3 User's Guide
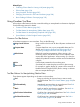
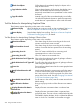
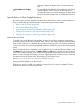
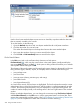
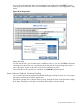
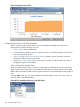
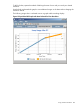
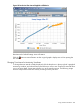
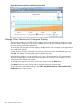

Figure 79 Using the Pause Clock
Changing Time Interval in GC Data Visualizers
The GC viewer provides several ways for you to manipulate the breadth of the data in the
specialized GC visualizer displays. You can
• select a subset of the available data.
• continue selecting subsets to zoom in to specific events in ever smaller periods of time and/or
ever narrowing range of data.
• apply a selected interval across all of the metrics, making it easy to look at the same time
period from different metric points of view.
• quickly return to the original graphs of the metric or metrics in order to select a new area of
the graph to explore in more detail.
Select a Subset of the Available Data
To select a subset of data, click one location on the graph and drag the mouse cursor across the
graph area from left to right until you have defined an area that you want to explore in more detail.
Release the mouse button, and the screen repaints with the new interval filling the entire graphical
area.
Using the View menu, you can choose whether to base the selection on the X axis, the Y axis , or
both. The X axis is the default setting.
Figure 80 The View Menu Selections in the GC Viewer
206 Using Visualizer Functions