
HPjmeter 4.3 User's Guide

between a display of elapsed time in seconds and clock
time.
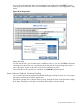
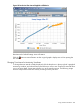
Select Metrics for Display
For the Multiple User-Defined, Glance Adviser, and Glance
System Call tabs, opens a pop-up window that lets you
configure the metrics you want to display by using the check
boxes to select the desired metric or combination of metrics.
Special Button or Other Gadget Functions
This section gives you more detailed information about the functions of some visualizer buttons to
help you make better use of these features. See the following sections for details.
• Mark an Item for Search (page 203)
• Find a Search Pattern (page 204)
• Pause or Resume Graphical Time-based Scrolling (page 205)
• Changing Time Interval in GC Data Visualizers (page 206)
• Changing Time Interval in Monitoring Visualizers (page 209)
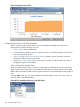
Mark an Item for Search
To enable you to work efficiently with multiple windows, the visualizers provide a simple means
of marking selected items such as methods, types, objects, and classes, and then locating marked
items in other windows, or in displays showing other monitoring metrics. The marking mechanism
is based on names, so it works across different data files provided they contain items with matching
names.
When you select an item in a display to mark (single-click the item with the left mouse button), click
the Mark button [ ] in the tool bar, or Mark to Find in the Edit menu. Marking an item copies the
name and/or other properties of the current item (highlighted by blue-green color) into the search
pattern. A status message will display in the lower right bottom of the visualizer widow, confirming
the selection that is the current mark. The message will look similar to this:
Marked java.util.BitSet.recalculatedUnitsinUse
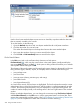
Using the Marked Object List on the Console
Each time an object is marked in a visualizer, a history list on the console is updated. The list is
limited to the seven most recent marked items.
Using Visualizer Tool Bars 203