
HPjmeter 4.3 User's Guide
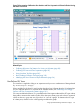
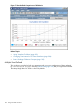
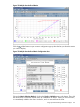
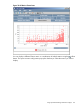
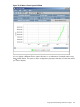
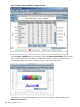

Figure 71 User-Defined Comparisons of GC Metrics
Related Topics
• Using Visualizer Tool Bars (page 201)
• Changing Time Interval in GC Data Visualizers (page 206)
• Basic Garbage Collection Concepts (page 103)
Multiple User-Defined
This visualizer is supplied to help you experiment with your own combinations of data gathered
by -Xverbosegc or -Xloggc, including Glance Data (page 194) that you might have collected.
The Heap Usage After GC metric is shown by default.
192 Using Visualizer Functions