
HPjmeter 4.3 User's Guide

possible, the most active allocation sites (the sites most likely to cause GC performance problems)
are reported.
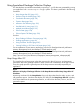
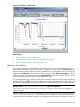
The allocation data can be displayed as either combined or separated time sets. Use the toolbar
button combined (the default) and separated to toggle between them.
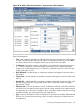
When the button is toggled to combined, the clock button is disabled, and the background color
is white. The default sort on this table is determined by % Allocated, and values in this column are
displayed in descending order, from greatest area of memory use to least. Making code changes
first in the area where memory use is greatest can have more significant impact on the heap. The
Combined Sets and Show Clock Time entries are also listed under the View menu.
Figure 65 GC Metric: Combined Sets of Allocation Site Statistics
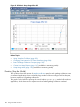
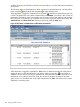
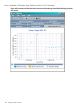
When the button is toggled to separated, a Time column is added to the left side of the table to
display the time at which the allocations were made, and the clock button on the toolbar is
enabled to let you choose clock time or elapsed time. If the table has more than one time set, the
background color of the first set will be white, the second will be gray, the third will be white
again, and so on. The default sort on this table is determined by Time, with values in this column
displayed in ascending order.
186 Using Visualizer Functions