
HPjmeter 4.3 User's Guide
This section contains some metrics derived from other metrics. The derived metrics are marked by
an asterisk (*). They are usually less frequently used, as they not always are immediately useful in
detecting performance bottlenecks. For each metric that presents the average values per call, only
methods called at least twice are taken into account.
The following metrics are available.
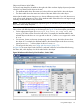
Contested Lock Claims by Method
The number of all attempts by individual methods to acquire a Java monitor lock while the lock
was being held by another thread, thus entailing a delay, even if only a very short one.
Related Topics
• Mark an Item for Search (page 203)
• Find a Search Pattern (page 204)
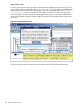
All Lock Claims by Method
The number of all Java monitor locks acquisitions by individual methods. The data is inherently
incomplete, because the metric is accumulated only since the first lock conflict for each lock. You
will see “partial data)” displayed after the metric label.
Related Topics
• Mark an Item for Search (page 203)
• Find a Search Pattern (page 204)
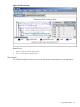
Lock Delay - Method Exclusive
Accumulated lock delay, wasted in the method acquiring the lock(s). The lock delay is the time
between an attempt to get the lock and the actual acquisition of the lock.
Related Topics
• Inclusive Versus Exclusive Time (page 82)
• Mark an Item for Search (page 203)
• Find a Search Pattern (page 204)
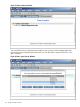
Lock Delay - Call Graph Tree
The inclusive lock delay shown on the call graph. Be sure to read the page on using the trees.
Related Topics
• Using Call Graph Trees (page 89)
• Inclusive Versus Exclusive Time (page 82)
• Mark an Item for Search (page 203)
• Find a Search Pattern (page 204)
Lock Delay - Method Inclusive
Accumulated lock delay, wasted in the method acquiring the lock(s) and all methods called from
it and their descendants.
Related Topics
• Inclusive Versus Exclusive Time (page 82)
• Mark an Item for Search (page 203)
• Find a Search Pattern (page 204)
178 Using Visualizer Functions