
HPjmeter 4.3 User's Guide
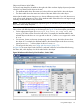
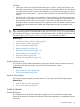
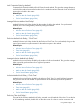

Figure 60 Threads Groups Histogram
Slider
In this metric visualizer, the slider lets you extend the view to encompass either the thread or thread
group view or a portion of both views.
Related Topics
• Reading Profiling Histograms (page 87)
• Change Color Selection for Histogram Display (page 210)
Profile by Locks
The lock delay is a measure for lock contention. The delay is caused by the lock being busy, and
is larger if the thread holding the lock is spending much time within the monitor, or when there are
many threads attempting to enter the same monitor.
Do not confuse lock delay with the time spent in the java.lang.Object.wait() method, or
with the time spent by a given thread within a Java monitor.
Lock metrics are produced only by the -Xeprof profiling option.
Note that the lock metrics do not show individual locks, but only values accumulated over all locks
used by a given method. Most methods, however, contain only one synchronization statement or
none at all, so identifying the contended lock should be easy if the source code is available.
Uncontested locks remain unprofiled for two reasons:
• Many locks are in use by a Java program, not always as the programmer's conscious choice.
For example, a java.util.Hashtable object used exclusively by only one thread or
accessed within a monitor, may be “synchronized” upon multiple times, yet with today's
advanced JVM technologies this behavior creates no penalty for the application performance.
Lock claims for such objects are not helpful to present.
• Because of the ubiquitous synchronization in many Java standard packages, profiling all locks
would be detrimental to the profiler's performance.
Using Profile Displays 177