
HPjmeter 4.3 User's Guide
• Mark an Item for Search (page 203)
• Find a Search Pattern (page 204)
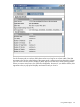
Exclusive Class Clock Times*
The total of the Exclusive Method Times (Clock), summed over all methods of the class. To see the
list of all contributing methods, double click on the class name. The standard methods
java.lang.Thread.sleep and java.lang.Object.wait do not contribute to this metric, however, they
will be shown on the list of all contributing methods for the respective classes.
Related Topics
• Inclusive Versus Exclusive Time (page 82)
• Time Units (page 82)
• Mark an Item for Search (page 203)
• Find a Search Pattern (page 204)
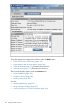
Profile Memory and/or Heap Activity
Most of the heap metrics are available only when analyzing a heap dump file. When using the
hprof tool to generate a heap dump, use the profiling option -agentlib:hprof=heap=all.
See the metrics table to check how to collect the profile data in order to obtain a specific metric.
The types of objects allocated on heap are classes and arrays. If the profile data file does not
contain the specific information related to objects, HPjmeter estimates Objects Created by Method
and Created Objects (Count) based on the number of class constructors called. In such cases, you
will see "(data estimated)" next to the metric label.
The estimation entirely misses the arrays, and may report inaccurate numbers. Some of the calls
to constructors may remain unprofiled, or be not recognized as such by HPjmeter. It is also possible
to err on the plus side, when HPjmeter does not properly recognize the class hierarchy.
These metrics – Reference Graph Tree, Reference Sub-tree by Size, Residual Objects (Count), and
Residual Objects (Bytes) – show the residual objects. These are objects remaining on the heap at
the time the profile data file is written.
Objects Created by Method
Number of objects of all types created by each method. Double click on the method name to see
the distribution of the number over object types.
Related Topics
• Mark an Item for Search (page 203)
• Find a Search Pattern (page 204)
Created Objects (Count)
Number of objects of a given type, created by all methods, presented by object types. Double
click on the object type to see which methods created the objects.
Related Topics
• Mark an Item for Search (page 203)
• Find a Search Pattern (page 204)
Created Objects (Bytes)
Number of bytes occupied by objects of a given type, created by all methods, presented by object
types. Double clicking on the type name provides a list of allocation sites (methods) with the number
of bytes allocated by each listed method.
168 Using Visualizer Functions