
HPjmeter 4.3 User's Guide
These are possible reasons for reported starvation:
• the real starvation caused by the operating system scheduler - this should be distributed over
all methods in proportion to the exclusive CPU time consumed by each method
• waiting for the class loader to load a class
• waiting on an internal VM lock (mutex)
• time consuming system calls
• explicit or implicit Garbage Collection invocation (frequent or massive memory allocation by
the method)
• excessive virtual memory paging
• suspending the thread by external means (i.e. by a debugger)
Related Topics
• Class Loaders (page 173)
• Inclusive Versus Exclusive Time (page 82)
• Time Units (page 82)
• Mark an Item for Search (page 203)
• Find a Search Pattern (page 204)
Starvation Ratio*
Shows the starvation (see above) divided by the Exclusive Method Clock Time for each method.
Values close to one indicate that the method did not consume CPU, but nevertheless delayed
execution of the program. Such methods are worthwhile to investigate to understand the reason
of their behavior.
Related Topics
• Inclusive Versus Exclusive Time (page 82)
• Time Units (page 82)
• Mark an Item for Search (page 203)
• Find a Search Pattern (page 204)
Methods with Loops*
This metric tries to locate the most intensive loops in the application. The value is the average
number of times a loop within a given method was executed over all invocations of the method.
The actual loops are not instrumented (measured), and the calculations are based on the call counts
collected for the call graph, so the metric always provides only an estimate.
Related Topics
• Mark an Item for Search (page 203)
• Find a Search Pattern (page 204)
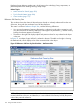
Exclusive Class CPU Times*
The total of the Exclusive Method Times (CPU), summed over all methods of the class. To see the
list of all contributing methods, double click on the class name.
Related Topics
• Inclusive Versus Exclusive Time (page 82)
• Time Units (page 82)
Using Profile Displays 167