
HPjmeter 4.3 User's Guide

Menu Choices
The menu bar can contain one or more of these choices, depending on the data type and visualizer
you are viewing:
• File — Contains selections for printing, saving, and comparing data, closing the window, or
opening another window that is viewing the same data file. Opening another window is useful
when you want to view more than one metric at the same time.
• Edit— When viewing eprof or hprof data, this menu provides the find functionality also
present on the tool bar for quickly navigating through tabular data. This menu also provides
two selections, Scale and Scale Special, that help to compensate for differences in time, for
example, when one or more files are being compared. See also Mark an Item for Search
(page 203) and Scaling Comparison Data (page 86)
When viewing vgc data, this menu contains options for manipulating or resetting the default
time interval seen in the graphical data presentation.
When monitoring an application, this menu contains options for selecting a portion or all of
the data set displayed in the Current Live Heap Objects visualizer.
• View — Provides mechanisms for hiding or revealing aspects of the window controls and
visualizer information, and when in the garbage collection viewer, provides many of the same
controls available from the button toolbar for manipulating the data display.
• Metrics — Contains these submenus and their associated profiling metrics:
Code/CPU◦
◦ Memory/Heap
◦ Threads / Locks
• Estimate — Provides heuristic profiling metrics that are estimated based on collected data.
• Sort — Provides a selector for choosing different ways to sort and display thread data. You
can sort threads chronologically, by combined weight (the default), by selected method usage,
by CPU usage, by lock contention, and by number of created objects.
• Scope — Provides selector for changing thread scope. You can look at scope by process,
thread, or thread group. See Adjusting Scope (page 83) for details.
• Tree— For call graph metrics, this menu provides controls for more quickly navigating the call
graph tree. See also Using Call Graph Trees (page 89).
• Help — Provides links to contextual help entries.
NOTE: Some profiling metrics may appear grayed out. These metrics may have been disabled
by specifying a JVM agent option. To obtain data with these metrics enabled requires running the
application with the appropriate JVM option.
Profile Code and/or CPU Activity
This section contains metrics that are derived from other metrics. The derived metrics are marked
by an asterisk (*). They are usually less frequently used, as they not always are immediately useful
in detecting performance bottlenecks. For each metric that presents the average values per call,
only methods called at least twice are taken into account.
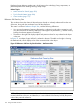
Method Call Count
Use this metric visualizer to see the methods called, the callers of each method, and the cumulative
number of calls from each caller.
The methods are sorted by decreasing number of calls. Listed to the left of each method is the
number of times it was called. By default, the list of methods includes the package in which each
Using Profile Displays 163