
HPjmeter 4.3 User's Guide

Related Topics
• Thread Histogram (page 152)
• Lock Contention (page 153)
Viewing Profiling or GC Data in HPjmeter
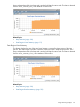
To view metrics for saved data:
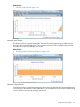
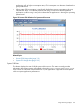
• From the main console, click File→Open to open a file browser window and locate your saved
file. You can also drag and drop the file onto the console.
Selecting the file automatically opens a data viewer.
In addition, a data representation for your file appears in the console main pane.
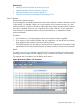
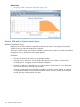
Double-clicking this representation brings an already open viewer to the top or opens a new
viewer if the original viewer has been closed.
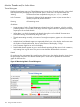
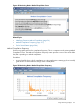
• Where available, use the Metrics and Estimate menus to access additional available metrics
and the Edit menu for special actions available for the different data types.
NOTE: A grayed-out menu item indicates that data is not available in the collected profile.
See also:
• Using Profile Displays (page 160)
• Using Specialized Garbage Collection Displays (page 181)
• Visualizer Behavior When Monitoring Behavior or Analyzing Data (page 134)
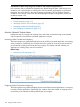
Using Profile Displays
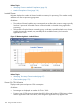
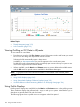
Profiling metric displays are available from the Metrics and Estimate menus in the profiling viewer.
These visualizers display data collected with -Xeprof and hprof options. Note that the hprof
data does not provide both CPU and clock times.
The following figure shows a profile viewer as it appears when first opened.
160 Using Visualizer Functions