
HPjmeter 4.3 User's Guide

Related Topics
• Identifying Excessive Method Compilation (page 56)
• Method Compilation Count (page 156)
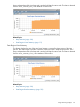
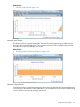
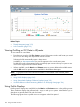
Loaded Classes
HPjmeter displays the number of classes loaded into memory for processing. This number usually
stabilizes over time as processing progresses.
Guidelines
• The number of classes loaded at any one time tends to oscillate within a narrow range; typically
less than 2 percent of all loaded classes will be unloaded or reloaded during application
processing.
• If the number of loaded classes constantly grows, it indicates a possibility that the new classes,
possibly dynamically created, may eventually fill the available memory and cause the
application to crash.
Figure 51 Monitoring Metric: Loaded Classes
Related Topics
• Identifying Too Many Classes Loaded (page 57)
• Class Loaders (page 173)
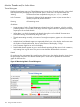
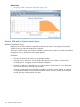
Percent (%) CPU Utilization
Displays total system and process CPU consumption.
Guidelines
• Percentages are displayed as number of CPUs x 100%.
• Excessive use of CPU resources (greater than 80% of the total number of CPUs) may indicate
that the application load limit is close, even though the application may appear to be
158 Using Visualizer Functions