
HPjmeter 4.3 User's Guide
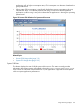

Considerations When Comparing Lock Contention and Thread Histogram Metrics:
Lock contention data is sampled less frequently than thread histogram data. When there is lock
contention with a short lifespan, a small amount of lock contention might appear in the Thread
Histogram, but not be shown in the Lock Contention percentages. This can happen when the
contention occurs during a time when the Thread Histogram sample is being taken, but the lock
contention sample is not.
Related Topics
• Thread Histogram (page 152)
• Identifying Excessive Lock Contention (page 55)
• Identifying Deadlocked Threads (page 55)
• Data Sampling Considerations (page 213)
Monitor Network/Sockets Menu
Displays the rate of incoming and outgoing data, and socket connections being communicated
over the network to and from the monitored application over time.
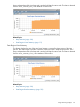
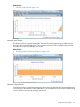
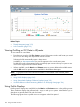
Incoming Socket Connections Frequency
This feature produces a graph that displays the rate at which the monitored application is accepting
socket connections. Specifically, this visualizer shows the number of incoming socket connections
per minute that are being received by the Java program. This display indicates whether your
application is handling many network connections.
Related Topic
• Network Input Stream (page 155)
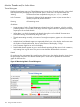
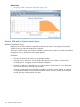
Outgoing Socket Connections Frequency
This feature produces a graph that displays the rate at which the monitored application is connecting
to sockets of other applications. Specifically, this visualizer shows the number of outgoing socket
connections per minute that are being made by the Java program.
154 Using Visualizer Functions