
HPjmeter 4.3 User's Guide
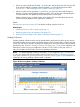
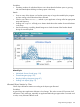
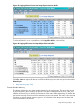

Sampling minimizes overhead and focuses attention on user code. To discover allocation statistics
about application server classes, use the include and exclude filtering flags in the JVM agent
options.
The reported data is cumulative over the lifetime of the session, and accuracy will improve as the
session length increases.
Figure 43 Monitoring Metric: Allocating Method Statistics
Related Topics
• JVM Agent Options (page 27)
• Allocated Object Statistics by Class (page 145)
• “Data Sampling Considerations” (page 213)
• Mark an Item for Search (page 203)
• Find a Search Pattern (page 204)
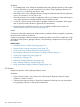
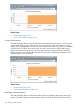
Current Live Heap Objects
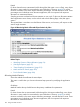
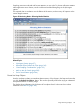
Use this visualizer to obtain an immediate data summary of live objects in the heap each time that
you click the Refresh Live Objects button. This can be especially useful when trying to understand
unexpected behavior in memory usage.
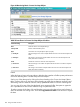
The display shows information for the classes of live objects found. It does not show indirect
references. See Table 22 (page 148).
Using Monitoring Displays 147