
HPjmeter 4.3 User's Guide

Details
For those classes that are instrumented (visible through the JVM agent verbose flag), every object
allocation in every method is instrumented to report allocations. However, sampling is used to
minimize overhead, so the metric reports allocation percentages, not total allocation counts. These
percentages are not absolute across the entire application, but are computed with respect to
allocations in instrumented classes.
Sampling minimizes overhead and focuses attention on user code. To discover allocation statistics
about application server classes, use the include and exclude filtering flags in the JVM agent
options.
The reported data is cumulative over the lifetime of the session, and accuracy will improve as the
session length increases.
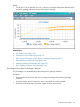
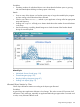
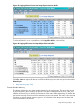
Figure 42 Monitoring Metric: Allocated Object Statistics by Class
Related Topics
• Identifying Excessive Object Allocation (page 54)
• JVM Agent Options (page 27)
• “Data Sampling Considerations” (page 213)
• Mark an Item for Search (page 203)
• Find a Search Pattern (page 204)
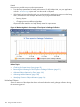
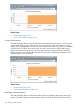
Allocating Method Statistics
Shows the methods that allocate the most objects.
This metric is useful when you choose to decrease heap pressure by modifying the application
code.
Guidelines
Methods listed at the top should become the primary candidates for optimization.
Details
For those classes that are instrumented (visible through the JVM agent verbose flag), every object
allocation in every method is instrumented to report allocations. However, sampling is used to
minimize overhead, so the metric reports allocation percentages, not total allocation counts. These
percentages are not absolute across the entire application, but are computed with respect to
allocations in instrumented classes.
146 Using Visualizer Functions