
HPjmeter 4.3 User's Guide
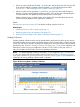

• When you select a high level of detail, 1 to 20 minutes, and the heap size does not go to the
local maximum before a garbage collection happens, it could indicate excessive calls to
System.gc(). See Identifying Excessive Calls to System.gc() (page 51).
• When you select coarse granularity, 1 to 24 hours, you may notice the overall change of
behavior in heap size and garbage collection pattern. This can help with understanding the
correlation between the application load and the pressure on the heap.
If there is plenty of gray in selected areas of the display, this means that the heap was too
small for the load imposed on the application at that time.
Details
You can pause and resume (page 205) the display scrolling using the clock icon.
Related Topics
• Identifying Excessive Calls to System.gc() (page 51)
• Determining the Severity of a Memory Leak (page 53)
• Reviewing the Percentage of Time Spent in Garbage Collection (page 51)
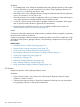
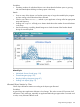
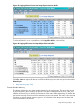
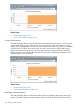
Garbage Collections
Displays garbage collection events over the period that the application has been running and an
estimated percentage of time spent in garbage collection. These events include collection from the
young, old, and survivor objects in the heap. This display does not include objects in the permanent
generation space. (See Basic Garbage Collection Concepts (page 103) if you are unfamiliar with
these terms.) When running your application with Java 5.0.12 or later or with Java 6.0.01 or
later, the visualizer can show major versus minor garbage collections.
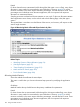
NOTE: For detailed garbage collection information, run your application with —Xverbosegc
or —Xloggc options and view the results in the GC viewer. See Obtaining Garbage Collection
Data (page 94) and Using Specialized Garbage Collection Displays (page 181) for information on
collecting and viewing garbage collection data in HPjmeter.
Figure 40 Monitoring Metric: Garbage Collections
Using Monitoring Displays 141