
HPjmeter 4.3 User's Guide

The integer is a count of how many times this exception has been thrown in this location, and
caught by this method. The percentage gives information on how often this exception is being
thrown in relation to all the detected thrown exceptions.
NOTE: Collecting the stack trace information could impair the performance of your application
if the application throws a large number of exceptions during the session. To minimize the effect
on your application, you can enable the Thrown Exceptions (page 138) metric, which does not
collect stack traces, when you start your session.
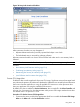
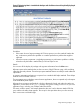
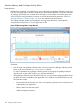
Figure 38 Monitoring Metric: Thrown Exceptions with Stack Traces
HPjmeter collects and reports exceptions caught in classes that are instrumented, that is, classes
that the JVM agent instrumentation rules have not excluded. To identify the JVM agent rules in
effect, you can use the JVM agent verbose option.
HPjmeter does not collect or report exceptions that are caught in methods filtered out by the exclude
JVM agent option.
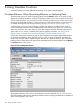
The display shows “No thrown exception detected since the session opened.” until HPjmeter detects
a thrown exception at which time it displays the information.
The window shows events in a hierarchical tree.
The View menu allows you to control the information displayed in the window:
• Select View→Show Percentages to alternatively hide or show the percentage value of the total
count for each exception, shown next to the count value.
• Select View→Show Packages to alternatively hide or show the Java package names to shorten
the lines in the display.
• Select View→Show Stacktraces alternatively expand or collapse the throw location stack traces
of all the exception nodes, or click on a specific node to expand or collapse its throw location
stack trace only.
The results are cumulative over the lifetime of the session.
Related topics
• Thrown Exceptions (page 138)
• Setting Monitoring Session Preferences (page 117)
• Setting Data Collection Preferences (page 46)
Using Monitoring Displays 139