
HPjmeter 4.3 User's Guide
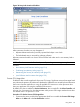
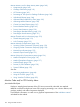
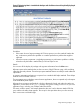
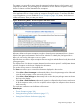

Figure 37 Monitoring Metric: Java Methods HotSpots with Confidence Interval Graphically Displayed
for Each Method
Guidelines
• If this metric shows a large percentage of CPU time spent in just a few methods listed at the
top, it indicates a performance problem or a method performance problem that might be
improved.
• When the top entry represents a single-digit percentage, a performance problem is unlikely
unless the entry describes a method that you did not expect to see.
Details
You can turn off the display of package and argument information from the View menu.
HPjmeter reports select methods that are the root cause of high CPU-time usage, while excluding
others that are rarely relevant. This technique reports methods that are most likely to need additional
optimization.
A common optimization technique is to improve how a method calls helper methods. These helper
methods are not included in the list.
The percentages are not absolute across the entire application, but are computed only with respect
to the methods HPjmeter reports.
HPjmeter does not report small methods, which are frequently inlined, and methods outside your
application, such as those in the java.* package. The goal is to help you zoom in on your core
application logic, including use of helper methods and APIs.
The metric window reports “No hotspot detected at this time” until it detects a Method CPU hot
spot, and then the metric data appears. The survey for hot spots often takes just a few seconds,
but in some cases could take longer.
Using Monitoring Displays 137