
HPjmeter 4.3 User's Guide
Monitor Memory and/or Heap Activity Menu (page 140)
• Heap Monitor (page 140)
• Garbage Collections (page 141)
• GC Duration (page 142)
• Percentage of Time Spent in Garbage Collection (page 143)
• Unfinalized Objects (page 144)
• Allocated Object Statistics by Class (page 145)
• Allocating Method Statistics (page 146)
• Current Live Heap Objects (page 147)
• Process Resident Memory (page 149)
• Process Virtual Memory (page 150)
• Data Region Resident Memory (page 150)
• Data Region Virtual Memory (page 151)
Monitor Threads and/or Locks Menu (page 152)
• Thread Histogram (page 152)
• Lock Contention (page 153)
Monitor Network/Sockets Menu (page 154)
• Incoming Socket Connections Frequency (page 154)
• Outgoing Socket Connections Frequency (page 154)
• Network Input Stream (page 155)
• Network Output Stream (page 155)
Monitor JVM and/or System Activity Menu (page 156)
• Method Compilation Count (page 156)
• Method Compilation Frequency (page 157)
• Loaded Classes (page 158)
• Percent (%) CPU Utilization (page 158)
• System Call Rate (page 159)
See also:
• Monitoring Applications (page 46)
• Using the Console (page 110)
• Using Visualizer Tool Bars (page 201)
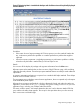
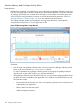
Monitor Code and/or CPU Activity Menu
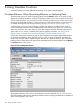
Java Method HotSpots
Displays a sampling-based estimate of the CPU time consumed by individual Java methods.
Methods are listed from highest to lowest CPU usage by percentage; over a session lifetime; with
package, method, and method arguments displayed.
Each method's information is written over a graphical representation of the confidence interval
calculated for that method.
136 Using Visualizer Functions