
HPjmeter 4.3 User's Guide
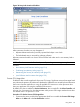
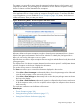
2. Once connected to the JVM, open the Alert Controller.
3. Scroll down if needed to see the Process CPU Usage Alert. Check this box also to turn this
alert on.
4. Set the usage threshold to reflect the expected consumption and designate a duration, if
desired.
5. Click Apply to activate checking for this threshold.
When the set threshold is met, an alert notice is posted on the console.
Double-click on the console alert to display the Percent CPU Utilization visualizer. In this visualizer,
you can see system and process CPU usage during the period of the monitoring session plotted
against the known resources of the server.
As an example, assume that you have a 4-CPU system, and you expect your Java application to
consume at least 1.5 CPU.
HPjmeter presents CPU utilization percentages as the number of CPUs x 100 to arrive at the total
possible percent of use. Therefore, expected use of 1.5 CPU would be equal to or greater than
150% of 1 CPU out of a total of 4 available CPU. By applying this value (150%) in the Alert
Controller, HPjmeter notifies you when that value is exceeded during the monitoring session. A
notification is generated for display on the console and recorded in the alert log.
Conversely, if you expect that your application will always use at least 100% of 1 CPU, set the
operator at less than or equal to 100% to trigger a notification that the application is not consuming
resources as expected.
For more information, see also:
• Set Session Preferences (page 37)
• Using Alerts (page 121)
• Percent (%) CPU Utilization (page 158)
• Identifying Unexpected CPU Usage by Method (page 49)
System CPU Usage Alert
This alert measures overall CPU usage for the entire system, not time spent in the system processor
state. Enable this alert to track target levels of system-level CPU usage. Significant variance from
target levels may indicate over- or under-utilization of system resources.
By default, this notification is enabled in Session Preferences, but is turned off in the Alert Controller
until you turn it on. Once turned on, this alert activates when system CPU utilization reaches the
set value. The default value is 50 percent of 1 CPU.
Procedure 4 To Set the System CPU Usage Alert
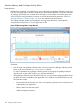
1. Connect to the server, and click the appropriate check box to enable the System CPU Usage
Alert on the Alerts tab in the Set Preferences window.
2. Once connected to the JVM, open the Alert Controller.
3. Scroll down if needed to see the System CPU Usage Alert. Check this box also to turn this
alert on.
4. Set the utilization threshold to reflect the consumption threshold and designate a duration, if
desired.
5. Click Apply to activate checking for this threshold.
When the set threshold is met, an alert notice is posted on the console.
Double-click on the console alert to display the Percent CPU Utilization visualizer. In this visualizer,
you can see system and process CPU usage during the period of the monitoring session plotted
against the known resources of the server.
As an example, assume that you have a 4-CPU system, and you expect your Java application to
consume no more than 3 CPU over any 5–minute period.
132 Using the Console