
HPjmeter 4.3 User's Guide
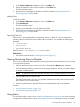
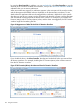
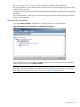
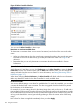
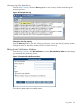
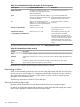
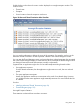
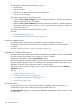

Table 21 GC Duration Alert Threshold by Java Version
Default Alert ThresholdMetric NameJava Version
> 2000 milliseconds (2 seconds)GC DurationHP 1.4.2.02 or later 1.4.x versions
> 30 secondsGC Duration (Major)HP 1.5.0.12 or 6.0.01 or later
> 2000 millisecondsGC Duration (Minor)HP 1.5.0.12 or 6.0.01 or later
Double-click on the alert to display the GC Duration visualizer.
See also:
• GC Duration (page 142)
• Heap Monitor (page 140)
• Viewing the Application Load (page 50)
• Checking for Long Garbage Collection Pauses (page 50)
• Current Live Heap Objects (page 147)
Heap Usage Alert
It can be useful to change the heap usage threshold in order to observe the heap structure at the
selected usage point.
You can also set this threshold to notify you when heap usage exceeds your maximum or minimum
expectations for the application.
By default, this alert is enabled in Session Preferences, but is turned off in the Alert Controller until
you turn it on. Once turned on, this alert activates when heap usage reaches the default value of
10 MB or more .
For example, if you expect that your application should never consume more than 100 MB of heap
for a target period of time, set the threshold fields for heap size and time sustained, and check
that the alert is enabled. If the set values are exceeded, an alert is generated and recorded in the
alert log. An alert notice is posted on the console.
Double-click on the alert to display the Heap Monitor. In this visualizer, you can see the memory
allocated to the heap compared to usage over time, and including indicators for garbage collection
events and their duration.
See also:
• Heap Monitor (page 140)
• Viewing the Application Load (page 50)
• Checking for Long Garbage Collection Pauses (page 50)
• Current Live Heap Objects (page 147)
Java Collection Leak Locations Alert
HPjmeter detects potential Java collection memory leaks and identifies the source-file line of the
leak. By default, this alert is activated when the leak is 10 MB/hour or more.
The console main window displays a Java Collection Leak Locations Alert when a Java collection
class memory leak is detected.
Double-clicking on the alert displays the Java Collection Leak Locations visualizer, which shows:
• Each detected Java collection leak object type
• The leak source location
• The leak duration
• The current size of the collection object
Using Alerts 129