
HPjmeter 4.3 User's Guide
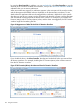
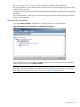
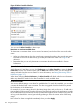
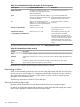
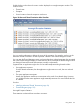
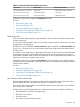
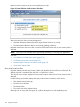

Figure 29 Alert Controller Window
You can use the Alert Controller in these ways:
Deactivate or reactivate enabled alerts.
To deactivate or reactivate alerts once a session has started, use the check box next to the alert
name.
• When you deactivate an alert, the console stops reporting that alert to the console main pane.
Note that a record of the alert activity up to that point has been written into a log file for
reference.
• Remember that you can only deactivate or reactivate alerts that are enabled in Session
Preferences.
Open the Session Preferences window to enable/disable alerts.:
With HPjmeter 4.0 and later, you can click Preferences on the Alert Controller to open the Session
Preferences window. The window opens with the Alerts tab selected. There, you can change the
settings selected when the session started. For more information, see Setting Monitoring Session
Preferences (page 117).
When done changing Session Preferences, the Alert Controller will refresh with the new information.
Make any alterations needed in the Alert Controller for newly enabled alerts.
Set alert thresholds.
You can use default settings or set values for enabled alerts. For each alert enabled, you can select
a numerical threshold and a time constraint. The alert is triggered when the threshold is passed
for the duration of the allotted time.
For example, if you are setting values for the Heap Usage alert, and you choose ≥ 50 MB and a
time constraint of 60 seconds, the alert will trigger when the heap usage in the application exceeds
the 50 MB threshold for at least 60 seconds. A notification appears in the console main panel for
as long as the threshold is crossed, periodically updating to show the current value of the heap
usage.
New values for alerts are applied immediately when you select Apply.
124 Using the Console