
HPjmeter 4.3 User's Guide
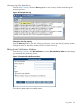

by using the Alert Controller. In addition, you can set thresholds in the Alert Controller to vary the
sensitivity of the console to enabled alert conditions, and you can edit e-mail notification attributes
submitted when you set session preferences.
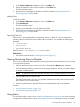
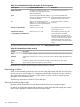
When active alerts are triggered, a notification appears in the main pane of the console window,
and the alert type and threshold value are displayed on all relevant metric visualizers. To view
details about the application behavior that triggered the notification, double-click on the specific
alert that you want to see. A metric window associated with the alert will open, with the alert type
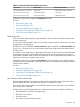
and its threshold value displayed at the bottom of the window. For example, if you enabled GC
Duration (Major) and GC Duration (Minor) alerts, and the alerts were triggered, the GC Duration
visualizer might look something like this:
Figure 26 Appearance of Alert Threshold in GC Duration Visualizer
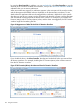
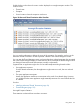
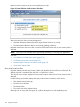
If you disable the alert in the Alert Controller, that alert and its threshold value are removed from
all relevent visualizers. For example, disabling the GC Duration (Minor) alert will then remove it
from the GC Duration visualizer:
Figure 27 GC Duration (Minor) alert Removed from GC Duration Visualizer
122 Using the Console