
HPjmeter 4.3 User's Guide

Specifying Metrics to Collect for Monitoring
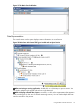
You can open the Session Preferences window at any time by double-clicking on an Open Session,
or single-clicking on it then clicking the Session Preferences toolbar button.
In pre-deployment or development, it is typical to enable all items. In deployment mode, when you
may be concerned about the impact on the application, you can enable a subset of the available
items. For more information about performance, see Performance Overhead on Running Applications
(page 212).
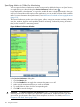
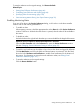
The Session Preferences window uses colors (green, yellow, orange) to associate a relative collection
cost (low, medium, high) for each capability. Reduce monitoring overhead by turning off metrics
that you don’t need for a monitoring session.
Figure 24 Metric Preferences Window
In the Session Preferences dialog box:
1. Click the Metrics tab.
2. Click the Enabled box to toggle the corresponding metric on or off.
3. Make sure the measurements that you want are enabled.
4. To modify filters or alerts, click the corresponding tab.
5. Click OK to save the changes.
CAUTION: TheThrown Exceptions with Stacktraces metric is unselected by default. Because
collecting stack traces can impair your application's performance, enable this metric only when
you need to get information about where most exceptions are thrown. For details, see Thrown
Exceptions with Stack Traces (page 138).
118 Using the Console