
HPjmeter 4.3 User's Guide

• Monitor — Contains these categorical submenus and their associated monitoring metrics:
JVM Summary◦
◦ Code/CPU
◦ Memory/Heap
◦ Threads/Locks
◦ JVM/System
• Help — Provides links to the HPjmeter User's Guide, getting started material, and demonstration
instructions.
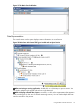
The Monitor Menu
The Monitor menu provides a summary of JVM information plus four submenus that give access to
the lists of specific available metrics. When you select a time slice (live or from a saved file), the
appropriate metrics for the Monitor menu become active so you can display the session data in
standalone visualizers. For details about specific monitoring metrics, see Using Monitoring Displays
(page 135).
Menus for selecting general profile data metrics are accessible within the profiling data viewer.
See Using Profile Displays (page 160).
NOTE: Some metrics may appear grayed out when you select a menu category. These metrics
may have been disabled in the session preferences or by specifying a JVM agent option. To
re-enable these metrics, you may need to close the current session and start a new session, enabling
the desired metrics in the Session Preferences window; or restart the application with different JVM
options; or both.
See Setting Monitoring Session Preferences (page 117).
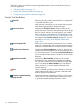
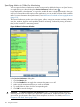
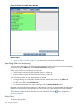
Console Guide
To aid in starting your use of HPjmeter, the console can display a beginning guide containing hints
for getting started. The guide provides hints appropriate to the object highlighted in the main
console pane.
116 Using the Console