
HPjmeter 4.3 User's Guide

Data from a session is saved by using the appropriate options on the command line when you
start your application.
• Collecting Profile Data (page 72)
• Setting Data Collection Preferences (page 46)
• Saving Monitoring Metrics Information (page 48)
Console Tool Bar Buttons
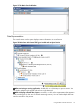
Open File
Select a previously saved monitor batch file, a snapshot file,
or a profile data file to view.
After opening a saved file, you can review data using the
menu metrics appropriate for the data file type.
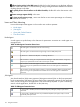
Connect to Server
Launches the Connect To Server dialog so that you can
specify the name of the host and optional port of the target
that you want to monitor. You must specify a port number
if the node agent was started on a nonstandard port. See
Connect to the Node Agent from the Console (page 34) for
an example of the Connect to Server dialog box. You can
also refer to Connecting to the HPjmeter Node Agent
(page 222).
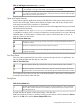
Save to Snapshot File
Allows you to save monitoring data from a live or cached
session to a snapshot file. You can then analyze the session
data later or send the data file to others for further analysis.
Open Session Preferences
Launches the Session Preferences window so that you can
change settings at the beginning of, or during (requires Java
6), a monitoring session. To activate the Session Preferences
icon, first select an Open Session counter row in the console
data tree.
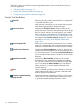
Open Alert Controller
Launches the Alert Controller so that you can change
thresholds and time sustained for available alert settings.
You can also set options for e-mail notification when alerts
occur. To activate the Alert Controller icon, first select an
Alerts counter row or click a specific alert listed in the
console data tree.
Close
Closes a selected monitoring session, deletes a connection
with a selected node agent, or removes a selected saved
data file entry from the data tree.
Generate extended profiling
(-Xeprof) data file
Launches the Remote Operations window for a live session
with a JVM. You can use the Remote Operations window
to generate extended profiling data from a JVM.
114 Using the Console