
HPjmeter 4.3 User's Guide
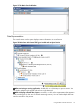
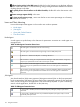
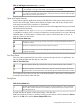
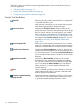
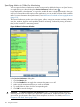
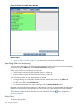

Table 15 JVM Agent Connection Icons (continued)
The JVM agent is not ready to open a session. Another console has already opened a session with
it, the JVM agent is running in batch mode, or the JVM agent is incompatible.
The JVM agent is unresponsive, that is, the node agent lost contact with it. The JVM might be down,
or it might be overloaded. Verify that the JVM is running and wait until it becomes responsive again
before opening a monitoring session with it.
Open and Cached Sessions
Session entries represent applications monitored by HPjmeter on the system. Many sessions can
exist for each node agent. Session entries display the system name and the port number of the
node agent connection if the connection is nonstandard.
An entry displays a process ID for the connection, the name of the application being run and state
information for the connection.
An entry marked Cached Application Data is a cached session. The data in a cached session
is available for analysis, but it is no longer connected to a running JVM and is no longer collecting
additional data. A cached session is created when a JVM in session terminates on its own, or
when you close an active session.
Table 16 Session State Icons
The session is running and working correctly, or the session is closed but the data for the session is
available for analysis.
The session is malfunctioning. Close the session and try to reopen it.
The session is unresponsive, that is, the node agent lost contact with it. The JVM might be down, or
it might be overloaded.
Time Slice Entries
Time slice entries represent the life span of the current monitoring session for an application. You
can view data throughout the life span of a time slice.
Table 17 Time Slice Icons
This entry displays the life span of the time slice. Click to activate the Monitor metric visualizers.
Alert entries represent current alerts. Double-click to open the visualizer that displays the data that
triggered the alert. (To see the alert history, check the alert log file accessible from the Alert Controller.)
You cannot store more than one time slice in the hierarchy below a JVM session. Closed sessions
accumulate at the bottom of the data tree.
Saving Data
Table 18 Saved Data Icon
The data represented has been saved from a previous run of the application or from a monitoring
session. Metric and alert information are available, but interactions that require connection to the
live node agent are not.
A saved data file will appear as the top-level entry in the data tree.
Data from monitoring a session is saved by clicking an open session, which activates the Save as
option on the File menu and the Save to Snapshot File button.
Using the Main Window Functions 113