
HPjmeter 4.3 User's Guide
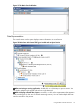
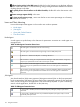
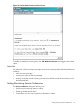
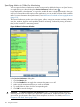
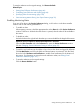
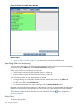

Figure 21 The Main Console Window
Data Representation
The console main window pane displays session information in a tree format.
Figure 22 Main Pane with Several File Types Loaded and an Open Session
When monitoring a running application, double-click on a JVM entry to open a session. You
can display multiple node agents and sessions in the data tree.
When analyzing collected data, Open a saved file, or click on the representation that appears
in the console pane (in this case a cached monitoring session). You can load multiple data sets
into the console for easy access.
Using the Main Window Functions 111