
HPjmeter 4.3 User's Guide

7 Using the Console
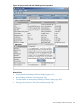
The console main window displays when you start HPjmeter.
Starting the Console
You can run the HPjmeter console on HP-UX, Linux, and Microsoft Windows systems.
Starting the Console On HP-UX
There are two ways to start the console on HP-UX.
• From the command line, type
/opt/hpjmeter/bin/hpjmeter
The console will be ready to display performance data. Connect to a JVM agent for real-time
data, or read a profile data file using the main window tool bar as described in the product
documentation.
• From an instance of HP Systems Insight Manager, select the systems that are running
applications that you want to monitor or profile.
Then from the HP Systems Insight Manager menu bar, click Tools →Java Management
→HPjmeter Console.
Starting the Console On Linux
To start HPjmeter, type from the command line:
/opt/hpjmeter/bin/hpjmeter
The console will be ready to display performance data. Connect to a JVM agent for real-time data,
or read a profile data file using the main window tool bar as described in the product
documentation.
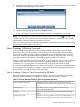
Starting the Console On Microsoft Windows
Assuming that you used the defaults suggested by the installation wizard, you can do one of the
following to launch the console.
• Double-click the short-cut icon for HPjmeter on your desktop.
• From the Start menu, select Program Files →HPjmeter →Console .
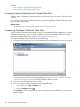
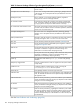
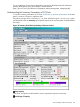
Using the Main Window Functions
The console, which is the main control area, contains a data pane, a tool bar, and menus. The
console is where monitoring is initiated and controlled and where data files of all types can be
opened for display in visualizers (standalone or within a tabbed viewer). See Using Visualizer
Functions (page 134) for the descriptions of how visualizers behave and the options they provide
for manipulating the data view.
110 Using the Console