
HPjmeter 4.3 User's Guide

Indicates whether or not process swapping is occurring during the measured period. To determine
the amount of swap memory occupied when processes are being swapped, click the System Details
tab, and locate the swap data in the System and Memory Details section.
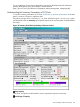
Comparison of Percentages
The color bars compare the percentage of time spent in Full GC or in System.gc calls as a
percentage of total time spent doing garbage collection. However, if the total time spent in
System.gc calls is greater than half the total time spent in Full GC, System.gc percentages will
display instead of Full GC percentages.
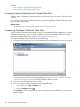
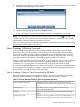
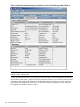
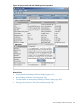
Understanding the System Details Captured with GC Data
To view the system details for GC data, select the System Details tab. If the value in a table cell
is too long, double click the data and a pop-up window will open to display the data.
The following image shows system details collected using the -Xverbosegc option and displayed
under the System Details tab.
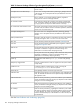
The data on this tab is a summary of operating system attributes and the JVM options in effect at
the time the data collection began. It can be useful to refer to this information when determining
adjustments to make in the size of the heap and/or the memory spaces.
Basic Garbage Collection Concepts 107