
HPjmeter 4.3 User's Guide


The highest percentage of actual use by the application of the heap at its final capacity
configuration. A rule of thumb for optimal utilization would be to have the eden space at 100%
with the survivor and old spaces showing some reserve capacity, depending on the application.
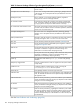
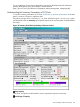
GC Activity Summary
In this example, a comparison of scavenges and full garbage collection of the old and permanent
generations, showing number of GC occurrences, duration, and memory usage for each GC type
displayed.
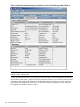
Duration of the Measurement
The approximate, elapsed, wall clock time for the entire data collection.
Measurement Enabled and Measurement Disabled
“Measurement enabled” refers to the total time during which zero preparation GC data collection
has been activated during the session thus far. “Measurement disabled” refers to the total time
during which no data was collected (zero preparation GC data collection is not in use). These
values are visible on this tab when zero preparation GC data collection is used during a monitoring
session. They are not present when collecting GC data using the -Xverbosegc or -Xloggc
options on the command line.
Total Bytes Allocated
The total amount of space created for new objects over the lifetime of the application. This number
represents the total amount of memory the program would have consumed had no garbage
collection been performed. It is an abstract measure of the total work done by the application.
Number of GC Events
The number of times the garbage collector was invoked during the program run.
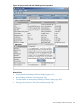
Average Ideal Allocation Rate
What the average memory allocation rate for new Java objects would have been had no garbage
collection been necessary. It is a theoretical limit of a program's performance if GC time were
driven to zero.
Residual Bytes
Heap usage when the program ends.
Time spent in GC
The total amount of wall clock time spent in garbage collection during the program run.
Percentage of Time in GC
The percentage of the total amount of wall clock time spent in garbage collection during the
program run. This value displays in red when 5% or more of clock time is spent in garbage
collection. When this value shows red, the amount of garbage collection activity should be
scrutinized.
Percentage of Time in Full GC
The percentage of the total amount of wall clock time spent doing a full GC during the program
run. This value displays in red when 5% or more of clock time is spent in a full garbage collection.
When this value shows red, the amount of garbage collection activity should be scrutinized. See
also “Comparison of Percentages” color bars.
Average Allocation Rate
The actual average memory allocation rate for new Java objects. See also Average Ideal Allocation
Rate.
Precise Data
For rounded values given in MB or GB, mouse over the value to see the measure in precise bytes.
Process is Swapping
106 Analyzing Garbage Collection Data