
HPjmeter 4.3 Release Notes and Installation Guide


2 New in This Version
Various enhancements and defect fixes are included in this release.
New Features and Enhancements
HPjmeter 4.3 provides the following major enhancements:
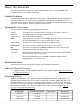
• A minimum of Java 6 is required to run the HPjmeter console.
• HPjmeter provides a shell script (/opt/hpjmeter/bin/hpjmeter) to easily start the HPjmeter
console. In version 4.3, the default Java heap size is increased to 512 MB on Microsoft
Windows and 1 GB on UNIX systems. Previously, the default heap size was 256MB. You
can continue to specify a different size for the Java heap by passing the size as an argument
when running the script, for example: /opt/hpjmeter/bin/hpjmeter –Xmx2g
• Starting HP JDK/JRE 7.0.04, the –Xverbosegc option supports the G1 garbage collector.
HPjmeter 4.3 supports viewing both the –Xverbosegc and –Xloggc output that contain
G1 specific fields.
• Enhanced zero preparation profiling (-Xeprof) is a feature of the HP JDK/JRE 7.0.04. Profiling
can now be started from the HPjmeter console while performing real-time monitoring of a
running Java application. Further details can be found at “Collecting Profile Data” in chapter
5 of the HPjmeter 4.3 User’s Guide.
• The new Network/Sockets visualizers display the rate of incoming and outgoing data and
socket connections being communicated over the network to and from the monitored application
over time. Further details can be found at “Monitor Network/Sockets Menu” in Chapter 8 of
the HPjmeter 4.3 User’s Guide.
• In the Heap Monitor visualizer, the maximum committed Java heap space, shown on the
visualizer as committed space, is now displayed in addition to the maximum occupied heap
space. Note that the committed space is not the same as the maximum possible heap (-Xmx
value). The display of the committed space can be toggled on and off using the View menu.
• Four new visualizers, Process Resident Memory, Process Virtual Memory, Data Region Resident
Memory, and Data Region Virtual Memory, within the Memory/Heap Monitor are introduced
in HPjmeter 4.3 release.
• The new System Call Rate visualizer within the JVM/System Menu Monitor displays the rate
of a set of HP-UX system calls over time.
• Additional command line options for the HPjmeter agent are introduced, which can disable
specific metrics. Further details can be found at “JVM Agent Options” in chapter 2 of the
HPjmeter 4.3 User’s Guide.
See the HPjmeter 4.3 User's Guide for information on these enhancements.
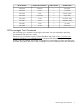
Defect Fixes
Defect fixes provided in HPjmeter 4.3 result in improved data accuracy and reduced memory
usage.
Defect fixes include those in the following table:
Table 1 Defect Fixes in HPjmeter 4.3 Release
Behavior in 4.2 or Older VersionsNew Behavior in 4.3Defect Tracking Number
The GC Duration visualizer would display
the Major and Minor alert thresholds in
The GC Duration visualizer now uses
consistent time units (milliseconds) when
QXCR1001070562
different time units, without any labels. Adisplaying the Major and Minor GC alert
typical display would be something likethresholds. A typical display is now
“GC Duration (Major) >= 30.0, GCsomething like “GC Duration (Major) >=
8 New in This Version