
HPjmeter 4.3 Release Notes and Installation Guide

3 Known Problems and Workarounds
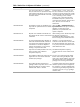
• The JVM agent may not be able to instrument and collect metrics for certain methods. Review
the JVM agent log file to identify the methods that were not measured. The path to the JVM
agent log file is:
/var/opt/hpjmeter/log/HPjmeter.jvmagent_pid.log
where pid is the process ID of the associated JVM agent.
The log file shows this message for non-instrumented methods:
Cannot instrument method method_name
• To minimize impact on your system, do not run the console on a machine that is a managed
node.
The console uses 512 MB of memory on Microsoft Windows and 1 GB of memory on UNIX
systems by default. For a long-running monitoring session, start the console with >1 GB of
Java heap.
• When using a console through remote window manager software, you might notice degraded
performance in the speed at which graphics are drawn.
For best performance, run the console on your local machine.
• The HPjmeter console is not supported on Microsoft Windows 8.
• During the installation of the HPjmeter console using the Microsoft Windows installation
executable (.exe), the desktop icon always defaults to 'HPjmeter' even though you might have
directed the installation to create product icons in a new 'Program Group' with a different
name other than 'HPjmeter'.
10 Known Problems and Workarounds