
HPjmeter 4.2 User's Guide
it looked the last time. With this menu item disabled, the console looks in the current
directory. This menu selection is enabled by default.
◦ Remember Main Window Location
Click the menu item to toggle whether HPjmeter places the console window in the
same location when you restart.
◦ Cascade Metric Windows
Click the menu item to have HPjmeter open new metric windows position so you
can see the windows beneath the newly opened window.
◦ Show Console Guide
The Console Guide is enabled by default and appears in a pane below the main
console data pane. Use this menu selection to hide or reveal the guide pane.
◦ Confirm Save When Closing the Main Window
On exiting, HPjmeter will check that all new data collections or sessions have been
saved. If they have not been saved, HPjmeter will provide an opportunity to save
cached data. This selection is on by default.
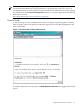
— Standard Preferences
Allows you to import, export, delete, or reset preference settings.
◦ Import Preferences from File
You can import HPjmeter_preferences.xml to populate the preference data
of a new installation by placing this file in your home directory and selecting this
choice.
◦ Export Preferences to File
You can save the contents of the backing store by exporting it to a file named
HPjmeter_preferences.xml in your home directory.
◦ Delete Preference Backing Store
Use this selection to delete the contents of the backing store. The backing store
automatically collects the settings that you choose each time you run HPjmeter.
◦ Reset Default Color Preferences
Resets all color changes made to visualizer displays back to the default settings.
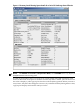
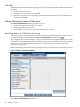
• Monitor — Contains these categorical submenus and their associated monitoring metrics:
— JVM Summary
— Code/CPU
— Memory/Heap
— Threads/Locks
— JVM/System
• Help — Provides links to the HPjmeter User's Guide, getting started material, and
demonstration instructions.
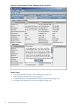
The Monitor Menu
The Monitor menu provides a summary of JVM information plus four submenus that give access
to the lists of specific available metrics. When you select a time slice (live or from a saved file),
the appropriate metrics for the Monitor menu become active so you can display the session data
in standalone visualizers. For details about specific monitoring metrics, see Using Monitoring
Displays (page 117).
Menus for selecting general profile data metrics are accessible within the profiling data viewer.
See Using Profile Displays (page 137).
98 Using the Console