
HPjmeter 4.2 User's Guide

preparation GC data collection is used during a monitoring session. They are not present when
collecting GC data using the -Xverbosegc or -Xloggc options on the command line.
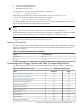
Total Bytes Allocated The total amount of space created for new objects over the lifetime of
the application. This number represents the total amount of memory the program would have
consumed had no garbage collection been performed. It is an abstract measure of the total work
done by the application.
Number of GC Events The number of times the garbage collector was invoked during the
program run.
Average Ideal Allocation Rate What the average memory allocation rate for new Java objects
would have been had no garbage collection been necessary. It is a theoretical limit of a program's
performance if GC time were driven to zero.
Residual Bytes Heap usage when the program ends.
Time spent in GC The total amount of wall clock time spent in garbage collection during the
program run.
Percentage of Time in GC The percentage of the total amount of wall clock time spent in
garbage collection during the program run. This value displays in red when 5% or more of clock
time is spent in garbage collection. When this value shows red, the amount of garbage collection
activity should be scrutinized.
Percentage of Time in Full GC The percentage of the total amount of wall clock time spent
doing a full GC during the program run. This value displays in red when 5% or more of clock
time is spent in a full garbage collection. When this value shows red, the amount of garbage
collection activity should be scrutinized. See also “Comparison of Percentages” color bars.
Average Allocation Rate The actual average memory allocation rate for new Java objects. See
also Average Ideal Allocation Rate.
Precise Data For rounded values given in MB or GB, mouse over the value to see the measure
in precise bytes.
Process is Swapping Indicates whether or not process swapping is occurring during the
measured period. To determine the amount of swap memory occupied when processes are being
swapped, click the System Details tab, and locate the swap data in the System and Memory
Details section.
Comparison of Percentages The color bars compare the percentage of time spent in Full GC
or in System.gc calls as a percentage of total time spent doing garbage collection. However,
if the total time spent in System.gc calls is greater than half the total time spent in Full GC,
System.gc percentages will display instead of Full GC percentages.
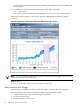
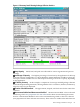
Understanding the System Details Captured with GC Data
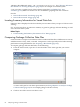
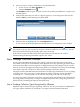
To view the system details for GC data, select the System Details tab. If the value in a table cell
is too long, double click the data and a pop-up window will open to display the data.
The following image shows system details collected using the -Xverbosegc option and
displayed under the System Details tab.
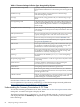
The data on this tab is a summary of operating system attributes and the JVM options in effect
at the time the data collection began. It can be useful to refer to this information when determining
adjustments to make in the size of the heap and/or the memory spaces.
90 Analyzing Garbage Collection Data