
HPjmeter 4.2 User's Guide

Let the collection generated by the JVM continue for the length of time that you think will
be meaningful.
4. Stop the data collection interval by sending the same signal to the JVM:
kill -PROF pid
You can now open the saved file in the HPjmeter console and view the collected metrics.
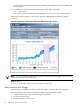
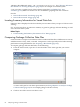
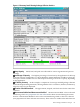
Time periods where no data is collected are shown in a light purple in all the GC graphic
visualizers.
Figure 6-1 Appearance of GC Data Collected in Intervals During a Session
NOTE: For the signal to be captured by the JVM, you must either be logged in as root, or you
must be the user who started the JVM.
Related Topics
• Using Specialized Garbage Collection Displays (page 157)
Data Collection with -Xloggc
-Xloggc directs a smaller set of data to a file than what is available with -Xverbosegc.
For every garbage collection, the following six fields are printed to the log file:
• Cumulative time since data collection began (in seconds)
• Garbage collection type
• Heap in use before the GC event
84 Analyzing Garbage Collection Data