
HPjmeter 4.2 User's Guide

Collecting Allocation Site Statistics for Viewing in HPjmeter
Use the following command to capture allocation site statistics in a file for display in the HPjmeter
garbage collection viewer. The GC viewer automatically opens when you open an Xverbosegc
file from the HPjmeter console in one of the following ways:
• Using -XX:+PrintAllocStatistics option to enable the Allocation Statistics function
by entering the following:
$ java ... -XX:+PrintAllocStatistics -Xverbosegc[0|1][:file=[filename[,[n][h][d][u][t]]]]
• Sending a signal to the JVM to capture allocation site statistics data at that time:
$ kill -PROF pid
OR
$ kill -21 pid
Data from the opened file is visible in the Allocation Site Statistics (page 161) visualizer.
Collecting Glance Data for Viewing in HPjmeter
If you have the HP GlancePlus product installed on your HP-UX system, you can run GlancePlus
in adviser mode using the script at /opt/hpjmeter/bin/javaGlanceAdviser.ksh. This
script has three command-line parameters: the pid of the Java process for which you want to
collect data, the name of the output file to receive the data, and the sampling interval, in seconds.
Only the first parameter is required, the second and third are optional. Here is a sample command
line to capture Glance data in a file for display in the HPjmeter garbage collection viewer:
$ /opt/hpjmeter/bin/javaGlanceAdviser.ksh 1234 ga.out.1234
This command collects information about process 1234 using the default sampling interval, and
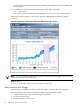
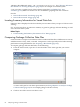
writes the results to the file ga.out.1234. You can then open this file in the HPjmeter console
to view the data graphically. If you also collected GC information using the -Xverbosegc
option, you can append the Glance data to the GC log file and then use HPjmeter to read the
combined file. Collecting both the Glance data and the GC data at the same time is very useful
because you can view all the data together in one HPjmeter console.
Data from the opened file is visible in the Glance Data (page 170) visualizer, accessible from the
Glance Adviser tab on the GC visualizer. Glance system call data is obtained from the
PROC_SYSCALL loop in Glance Plus, and is visible in the Glance System Call Data (page 174)
visualizer, accessible from the Glance System Call tab on the GC visualizer.
Collecting GC Data with Zero Preparation
Zero preparation GC data collection is a feature in the HP JDK/JRE 5.0.14 and later, and 6.0.02
and later. It is started from the command line by sending a signal to the JVM to start GC data
collection.
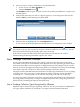
To collect GC data without interrupting an already running application, do the following from
the command line:
1. Confirm that HP JDK/JRE 5.0.14 or later, or 6.0.02 or later is running the application that
you want to analyze, and that no -Xverbosegc or -Xloggc option has already been
specified.
2. Locate the process ID of the running Java application.
3. Start the profiling interval. Send a signal to the JVM by typing:
kill -PROF pid or kill -21 pid
The GC data will be written to a file named java_pid.vgc in the current directory of the
JVM process.
Obtaining Garbage Collection Data 83