
HPjmeter 4.2 User's Guide

from the caller to the number of all calls to this method from all callers. It may be non-intuitive
to traverse this graph if you get used to the call graphs representing time. This is because
below a low number of calls—for example, 1—a very large number of further calls can be
hidden.
In cases when there is more than one caller of a method, the number of other callers is also given.
Example of Node Color Display
It is best to explain the meaning of the numbers in a tree in an example. Here's a snippet from a
Call Graph Tree with times:
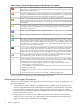
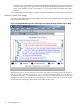
Figure 5-2 Multiple Nodes Exposed in Call Graph Tree Display Showing Visitation Color Coding
In the picture above, you can see that run was the only caller of sleepPerTab. The inclusive
time for all calls to sleepPerTab was 6,883,833 time units. Lower down, you can see that
sleepPerTab used 2,966 time units on calls to setValue , which represents 97% of the total
inclusive time used by this method. The remaining 3% of time used by setValue was caused
by calls from the remaining callers (three other callers in this case).
76 Profiling Applications