
HPjmeter 4.2 User's Guide
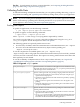
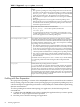
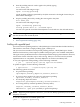
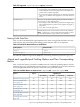
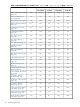
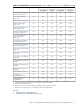
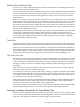
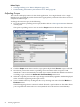

Table 5-2 Supported -agentlib:hprof options (continued)
Controls the depth of the stack trace for each stack trace taken.
depth=size
• Increasing this value will make the profile data file larger, but it
enables HPjmeter to better estimate inclusive method times and
generate more complete call graphs.
• If you measure application performance by sampling, the default
value of 4 is too small for most applications; use values between 6
and 12.
This is the cut-off value for printing the list of methods with their
exclusive times or object allocation sites.
cutoff=value
• Decreasing this value will make the profile data file slightly larger,
but it enables HPjmeter to produce more complete call graphs or
heap metrics.
• Use a value of 0 for all applications.
HPjmeter displays both ASCII and binary format of the profile file.
NOTE: Note that hprof does not list method arguments. In effect,
all overloaded methods are represented as just one method.
format=a ,format=b
Naming Profile Data Files
Table 5-3 shows the default file types HPjmeter uses when saving profile data files. You may
want to follow this convention when naming profile data files, but it is not required.
Table 5-3 Default File Name Suffixes for Profile Data
File Name SuffixProfiling Option
.eprof-Xeprof
.hprof.txt-agentlib:hprof
For other file suffixes recognized by HPjmeter, see Naming Monitoring Data Files (page 39)
–Xeprof and –agentlib:hprof Profiling Options and Their Corresponding
Metrics
Table 5-4 lists the metrics or features available with each of the two profiling options used for
collecting data. An * (asterisk) after a metric means it is a combination of one or more measures.
N/A (not applicable) means the option is irrelevant to the particular feature.
Table 5-4 Available Metrics or Features from -Xeprof and -agentlib:hprof Data
-agentlib:hprof-XeprofFeature
heap=sitesheap=dumpcpu=timescpu=samples
N/AN/AYes
2
NoYesMethod Call Count (page 140)
N/AN/AYes
1
Yes
1
YesExclusive Method Times
(CPU) (page 141)
N/AN/ANoNoYesExclusive Method Clock
Times (page 141)
N/AN/AYes
2
NoYesCall Graph Tree with Call
Count (page 141)
N/AN/ANoNoYesCall Graph Tree with Clock
Time (page 142)
N/AN/AYes
1,2
Yes
1,2
YesCall Graph Tree with CPU
(page 142)
–Xeprof and –agentlib:hprof Profiling Options and Their Corresponding Metrics 65