
HPjmeter 4.2 User's Guide

To see the availability of HPjmeter metrics from hprof data collection, see –Xeprof and
–agentlib:hprof Profiling Options and Their Corresponding Metrics (page 65). For additional
information on collecting heap dump data, see the Java™ Troubleshooting Guide for HP-UX Systems.
NOTE:
With the addition of JVMTI in JDK 5.0, the -agentlib switch is the preferred way to activate
tools such as hprof. With -agentlib, you can take advantage of improvements in JDK 5.0 and
reduce the impact of data sampling on application performance. While -Xrunhprof can still
be used to specify the JVM agent with Java 5 versions, the impact on application performance is
significantly greater than when using -agentlib.
You will still need to use -Xrunhprof to specify the hprof agent for earlier supported versions
of Java (1.4.x).
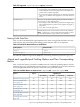
Here are the supported -agentlib:hprof options that affect the collection of profile data:
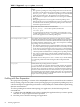
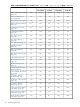
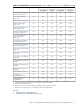
Table 5-2 Supported -agentlib:hprof options
The heap dump shows all objects remaining in memory at the time of
the dump. The allocation sites show where the objects were created
heap=dump|sites|all
during the execution of the program. Heap analysis can be used to
locate memory leaks, and the allocation sites can be used to minimize
the memory usage.
To solve memory retention problems, the best practice is to use a signal
rather than the application shutdown to obtain the heap dump. When
the application shuts down, some references go out of scope and the
retention problem may get eliminated just before the heap is dumped.
Send the signal at the moment that you suspect the application is
holding references to no longer needed objects.
To keep the heap dump size down, try to send the signal just after a
full garbage collection (use -verbose:gc to be notified about the
garbage collections).
Remember that a heap dump contains all objects, not just live objects
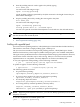
cpu=samples uses sampling as the collecting technique, while
cpu=times uses tracing with reduction.
cpu=samples|times
• Typically, the times collected by cpu=samples|times are CPU
virtual times. However, HP-UX 11i versions use real CPU times
rather than CPU virtual times unless sampling is used.
• Some implementations of cpu=times report clock time. HPjmeter
tries to figure out what times actually have been collected, but
sometimes does not do it right.
• cpu=samples and cpu=times output exclusive times.
• Collecting heap data can be very intrusive, so we recommend that
you measure the method times and heap usage at different times.
However, it may make sense to specify heap=sites and
cpu=samples|times for the same run when you want to locate
the allocation sites in the call graph.
Controls whether the stack traces collected during program execution
will be associated with an individual thread.
thread=y|n
• By default, no thread identification information is stored
(thread=n).
• We suggest that you always specify thread=y.
• With the thread identification in the profile file, HPjmeter can
calculate the thread profile data for the entire application.
64 Profiling Applications