
HPjmeter 4.2 User's Guide
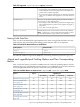
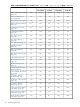
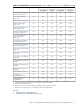
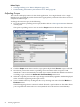

Table 5-1 Supported -Xeprof options (continued)
Specifies which signal will cause profiling termination and the profile data
output.
time_slice=sigusr1|sigusr2
• The signals for profiling start and profiling termination can be the same.
Specifying a signal and a timeout at the same time is possible by repeating
the time_slice option — termination of profiling occurs when the first
qualifying event takes place. The application will continue running.
• Only one of the two signals can be declared to use as the signal to terminate
profiling.
• During the application's run, the signal to terminate profiling can be
delivered to the Java process multiple times. However, profiling will only
be terminated and a result file generated if profiling is active when the
termination signal is delivered.
The profile data will be written to the named file.
• If time_on=sig... has not been specified, the default is
filename.eprof
If a signal has been specified to start profiling, several data files can be
created, with names filename_t.eprof, wheret is the time in seconds
between the application start and the profiling start.
file=filename
The compiler in the HotSpot VM optimizes Java applications by inlining
frequently called methods. Execution of an inlined method is not reported as
inlining=disable|enable
a “call” because the actual call has been eliminated. Instead, the time spent
in an inlined method is attributed to its “caller” The consequences of inlining
for profiling can be characterized as follows:
• The obtained profile data does not reflect faithfully all the calls within the
Java code as written by the programmer, but rather as it is actually executed
by the VM. For most performance analysis cases, this is a desired feature.
• As the calls within the Java application are eliminated, the corresponding
calls to the profiler are eliminated too, resulting in lower profiling overhead.
• The count of created objects cannot be reliably estimated from the call
graph in the presence of inlining, because the calls to the constructors may
have been inlined.
The default value for this option is enable. Another way to disable inlining
is to collect the profile data while running the VM in interpreted mode
(-Xint).
Enable/disable the profiling intrusion estimation.
ie=yes|no
ie=yes, the default value, specifies that the profiler estimates the profiling
intrusion and writes the estimated values to the profile data file. HPjmeter
uses this data to compensate for intrusion, which means that the estimated
intrusion is subtracted from the CPU times before they are presented to the
user. Disabling intrusion estimation slightly reduces the size of the data files,
but will also disable the intrusion compensation feature. This option has no
impact on the actual profiling overhead.
Profiling with Zero Preparation
Zero preparation profiling is a feature of the HP JDK/JRE 5.0.04. It is started from the command
line by sending a signal to the JVM to start eprof. Engaging zero preparation profiling may have
a short term impact on application performance as the JVM adjusts to the demands of performing
dynamic measurements.
To collect profiling data without interrupting your application, do the following from the
command line:
1. Confirm that a HP JDK/JRE 5.0.04 or later is running the application that you want to profile,
and that no -Xeprof option has been specified.
2. Find the process ID of the running Java application.
62 Profiling Applications