
HPjmeter 4.2 User's Guide

See also For information on how to compare data files, see Comparing Profiling Data Files
(page 71) and Scaling Comparison Data (page 72).
Collecting Profile Data
To take full advantage of HPjmeter functionality, you can gather profiling data using -Xeprof
for performance tuning and -agentlib:hprof for memory tuning when you run your application.
NOTE: If you are running the HP JDK/JRE 5.0.04 or later, you can send a signal to the running
JVM to start and stop a profiling data collection period with zero preparation and no interruption
of your application. See Profiling with Zero Preparation (page 62).
Profiling with -Xeprof
To profile an application, use the following command:
$ java -Xeprof:options ApplicationClassName
To profile an applet, use the following command:
$ appletviewer -J-Xeprof:options URL
where options is a list of key[=value] arguments separated by commas.
You can also stop the JVM (kill pid) or control the profiling time using the time_on or
time_slice options. See the descriptions in the list of options.
The following options are especially useful in most cases:
• For CPU time, clock time, and lock contention metrics with minimal intrusion, use -Xeprof
• For exact call count information and non-array object creation profiling, use
-Xeprof:inlining=disable
To see the complete list of available options, use java -Xeprof:help
-Xeprof always collects call graph data with inclusive method times (clock and CPU), method
call count, and lock contention metrics. This option uses tracing with reduction and collects the
data separately for each thread.
To see the availability of HPjmeter metrics from -Xeprof data collection, see –Xeprof and
–agentlib:hprof Profiling Options and Their Corresponding Metrics (page 65).
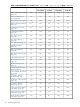
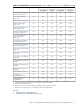
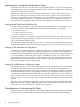
Table 5-1 Supported -Xeprof options
Specifies the time in seconds between the application start and the time when
the profile data collection will start. If no time_on option is present, the data
collection begins at the VM initialization.
time_on=integer
Specifies which signal will cause profiling to begin (profile data collection).
time_on=sigusr1|sigusr2
• Be aware that the application or the VM may already be using the sigusr
signals for their own purposes.
• Specifying a signal and a timeout at the same time is possible by repeating
the time_on option.
• Only one of the two signals can be declared to use as the signal to start
profiling.
• During the application's run, the specified signal can be delivered to the
Java process multiple times.
Specifies the time in seconds between the profiling start and the time when
profiling will be terminated.
time_slice=integer
• When the profiling is terminated, the profile data is written to a file. The
application will continue running.
• If time_slice is not specified, or if the application terminates before the
specified time elapses, but the profiling has started, the profile data will
be written out after the termination of the application.
Collecting Profile Data 61