
HPjmeter 4.2 User's Guide
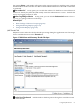
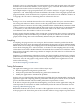

See details for a selected thread Click a thread name in the left pane. Details on thread activity
and current state appear in the right pane.
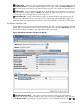
Apply a filter This filtering text box is useful when the thread list is long. It allows you to
reduce the list size according to the starting letters of the thread name. To apply a filter, start
typing the first few distinguishing letters of the thread names that you are interested in. The list
will immediately be trimmed to entries starting with those letters. Deleting text from the filter
box returns the list to its original state.
Detect thread deadlock At any point, you can check the box for “Detect Deadlock” to start
monitoring specifically for thread deadlock conditions. When a deadlock condition is encountered
for a particular thread, the text of the thread name turns red. Uncheck the box to stop watching
for this condition.
Related Topic
• Using Monitoring Displays (page 117)
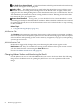
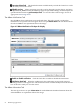
JMX Runtime Tab
The Runtime tab summarizes important characteristics of the runtime environment, including
data on the JVM version and uptime, options used to start the monitoring agent, and some aspects
of the hardware and operating system such as memory assignment, swap space, and operating
system type and version.
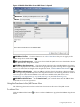
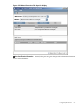
JMX Notifications Tab
Notifications triggered by changes that you make using the JMX viewer appear on the
Notifications tab. They are available for viewing for the duration of the open session or until
you clear them from the screen using the Clear All button.
See also The MBean Notifications Tab (page 56)
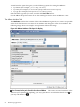
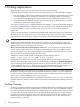
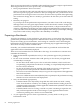
Changing Mbean Values and Monitoring the Result
Use the JMX server view to select the MBeans that you want to look at in detail. The following
image shows the default view on opening the JMX server view. An explanation follows the
image.
52 Monitoring Applications