
HPjmeter 4.2 User's Guide

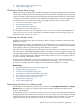
The Heap Monitor and Garbage Collections data help you determine if an observed application
termination could have been caused by running out of heap space.
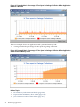
The Heap Monitor gives the idea about the overall heap limit, while the Garbage Collections
display shows the size of heap after each garbage collection.
If the heap size shown by Garbage Collections converges toward the heap limit, the application
will, or has, run out of memory.
Related Topics
• Expected Out Of Memory Error Alert (page 110)
• Garbage Collections (page 123)
• Heap Monitor (page 122)
• Current Live Heap Objects (page 129)
• How Memory Leak Detection Works (page 189)
• Heap Usage Notification (page 111)
• JMX Memory Tab (page 49)
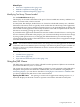
Identifying Excessive Object Allocation
Use the Allocated Object Statistics by Class display.
This metric shows the most frequently allocated object types.
Verify your understanding of the application memory use pattern with this metric. Resolving
this problem requires knowledge of the application.
Related Topics
• Allocated Object Statistics by Class (page 127)
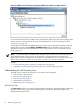
Identifying the Site of Excessive Object Allocation
Use the Allocating Method Statistics display.
This metric shows the methods that allocate the most objects. This metric is useful when you
decide to decrease heap pressure by modifying the application code.
Related Topics
• Allocating Method Statistics (page 128)
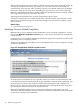
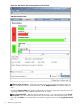
Identifying Abnormal Thread Termination
Look for the Abnormal Thread Termination Alert, which allows you to see a list of the uncaught
exceptions.
You can then use the Thread Histogram to investigate possible problems.
Terminated threads appear as a discontinued row. HPjmeter is unable to tell if the thread was
prematurely terminated or just completed normally. This is a judgment call, but in many cases
the analysis does not require extensive application knowledge.
If just one thread from a group of similar threads (by name, creation time and characteristics)
terminates, it is very likely that it was stopped.
A thread terminating abnormally does not necessarily bring the application down, but can
frequently cause the application to be unresponsive.
Related Topics
• Abnormal Thread Termination Alert (page 108)
• Thread Histogram (page 131)
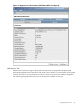
Identifying Multiple Short-lived Threads
Use the Thread Histogram.
44 Monitoring Applications