
HPjmeter 4.2 User's Guide

Editing the Finder
For each search field , you can either type in a different value, or you can click Clear to eliminate
information from the search. You can broaden the search (search on the package name only) or
narrow the search (search on the class name and/or method name only).
Once the fields are the way that you want them, click Find All to start the search.
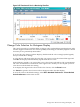
Pause or Resume Graphical Time-based Scrolling
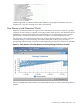
You can pause and resume graphical time-based scrolling by clicking the clock icon in the upper
left corner just above the visualizer display area.
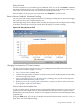
The following image shows a display that is running. Pressing the clock would pause the scrolling
of the data. Pressing the clock again would allow the display to resume scrolling.
Figure 8-45 Using the Pause Clock
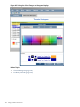
Changing Time Interval in GC Data Visualizers
The GC viewer provides several ways for you to manipulate the breadth of the data in the
specialized GC visualizer displays. You can
• select a subset of the available data.
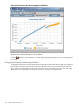
• continue selecting subsets to zoom in to specific events in ever smaller periods of time and/or
ever narrowing range of data.
• apply a selected interval across all of the metrics, making it easy to look at the same time
period from different metric points of view.
• quickly return to the original graphs of the metric or metrics in order to select a new area
of the graph to explore in more detail.
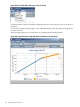
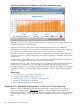
Select a Subset of the Available Data
To select a subset of data, click one location on the graph and drag the mouse cursor across the
graph area from left to right until you have defined an area that you want to explore in more
detail. Release the mouse button, and the screen repaints with the new interval filling the entire
graphical area.
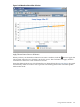
Using the View menu, you can choose whether to base the selection on the X axis, the Y axis , or
both. The X axis is the default setting.
Using Visualizer Tool Bars 181