
HPjmeter 4.2 User's Guide
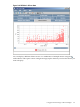
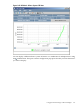

Show Hours:Minutes
Show data along the X-axis according to the hour and
minutes at which each event occurred.
Show Cumulative Seconds
Show data along the X-axis according to the cumulative
number of seconds that have passed since the recording
started.
Connecting Lines On
Show GC events with black lines connecting each
representative dot in order of occurrence.
Connecting Lines Off
Show GC events as unconnected dots .
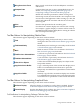
Color Distinctions for GC Types
On
Show colors that indicate the types of garbage collection
used during the application run.
Color Distinctions for GC Types
Off
Turn off colors that indicate the types of garbage collection
used during the application run.
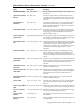
Zoom Out
Zoom out from selected interval to show entire graphed
area for current metric.
Apply Selected Interval to All
Metrics
Apply interval selected in current metric to all other metrics
in viewer. Note that the graph automatically zooms in on
the Y-axis to provide a more fine-grained view of the data
points while in this mode. See also Changing Time Interval
in GC Data Visualizers (page 181).
Reset Default Interval for All
Metrics
For all metrics in the viewer, reset the current interval to
the default setting.
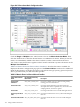
Filter Allocation Site Data
Bring up a pop-up window to filter allocation site statistics
data.
Display Allocation Site Data in
Combined Sets
Display allocation site statistics data in combined sets.
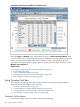
Display Allocation Site Data in
Separated Sets
Display allocation site statistics data in separated sets
grouped by times. The time column is added at the left
side of the table to display the date, which is collected at
different times. A clock icon is enabled on the toolbar to
toggle between a display of elapsed time in seconds and
clock time.
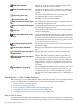
Select Metrics for Display
For the Multiple User-Defined, Glance Adviser, and Glance
System Call tabs, opens a pop-up window that lets you
configure the metrics you want to display by using the
check boxes to select the desired metric or combination of
metrics.
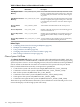
Special Button or Other Gadget Functions
This section gives you more detailed information about the functions of some visualizer buttons
to help you make better use of these features. See the following sections for details.
• Mark an Item for Search (page 178)
• Find a Search Pattern (page 179)
• Pause or Resume Graphical Time-based Scrolling (page 181)
• Changing Time Interval in GC Data Visualizers (page 181)
• Changing Time Interval in Monitoring Visualizers (page 184)
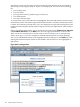
Mark an Item for Search
To enable you to work efficiently with multiple windows, the visualizers provide a simple means
of marking selected items such as methods, types, objects, and classes, and then locating marked
178 Using Visualizer Functions